
We conducted a study to examine how the 2011 Queensland Floods affected people’s incomes, tax deductions, and taxes owed. As natural disasters become more frequent and intense worldwide, it’s important to understand their impact on the fiscal system. Disasters create major policy challenges because helping people recover and rebuilding the economy requires large budgets from local and national governments.
Even when funding is available, economic recovery after disasters is difficult for at least two reasons. First, it’s hard to predict how economic agents will be affected by the aftermath of the disaster. Disasters can disrupt jobs and businesses, hitting vulnerable groups like low-income workers, and minorities the hardest. However, they can also create opportunities to rebuild infrastructure and start new businesses, potentially boosting economic growth.
Second, it’s not always easy to predict how people will respond to financial shocks caused by disasters. For example, following Hurricane Katrina, flood victims chose to use their insurance payments to pay off their mortgage loans instead of rebuilding their properties. Analogously, people may exhibit limited uptake of disaster-insurance because they expect government aid after a catastrophe, a phenomenon coined as the “Samaritan’s dilemma”. These unpredictable responses can make planning more difficult and increase disasters’ fiscal strain.
The Queensland Floods
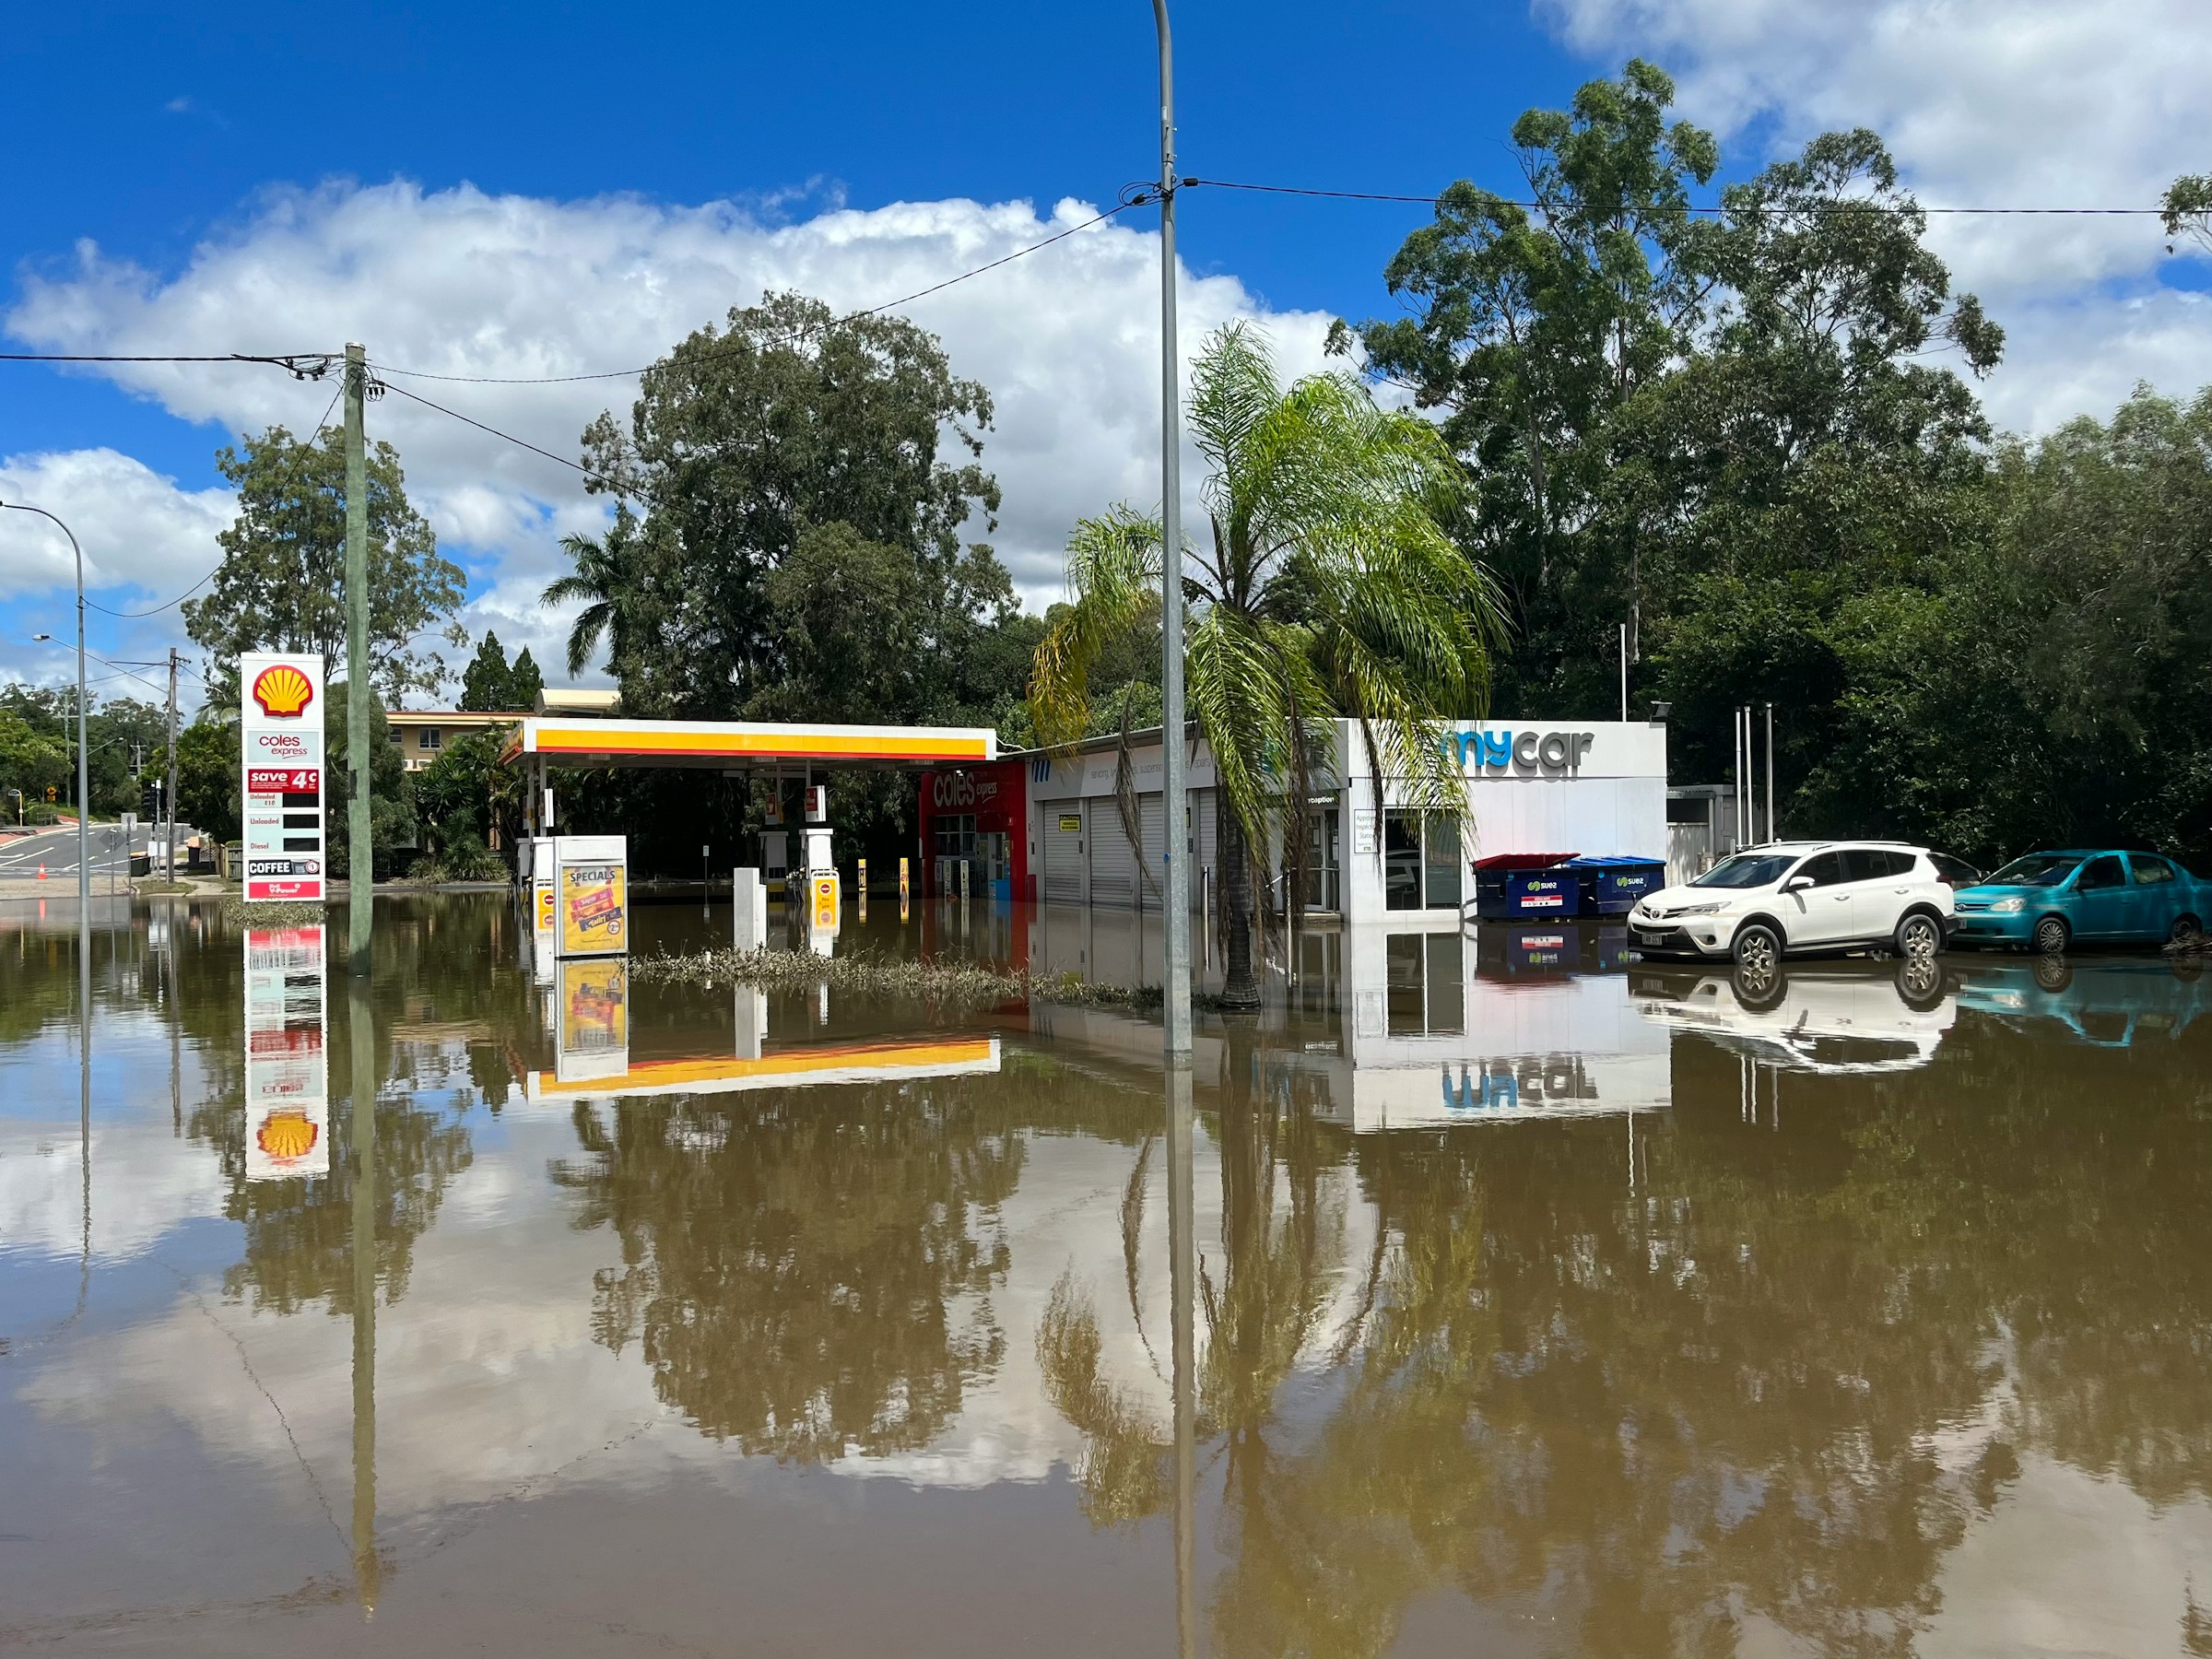
The 2010–2011 Queensland Floods were an extremely rare event that hit the Greater Brisbane area due to heavy rainfall between December 2010 and January 2011. The floods caused severe damage, especially in rural areas, but also in cities like Brisbane and Ipswich.
As a result, 33 people died and 2.5 million people were affected, leading to 78% of Queensland being declared a disaster zone. Initial estimates put the cost of the disaster at AU$5 billion, but later reports increased this figure to between AU$14.1 and 15.9 billion. About 29,000 homes and businesses were flooded, with 70% of the damage related to housing and infrastructure, and 30% linked to lost revenue and production.
Australia’s well-developed system for managing disasters, the Natural Disaster Relief and Recovery Arrangement, provides funding to states for recovery efforts. After the floods, local, state, and federal governments offered extensive support, with post-disaster relief estimated at AU$11.8 billion. The federal government contributed about AU$6 billion, and over AU$500 million was paid directly to individuals. These relief payments are not taxable and typically don’t appear in tax returns.
The Australian taxation system
People earning income in Australia use either a Tax File Number (TFN) or an Australian Business Number (ABN) as their unique identifier. If you are paid through a TFN, taxes are automatically withheld by your employer under the pay-as-you-go system. If you work with an ABN, you are considered a business and must pay your taxes yourself at the end of the fiscal year. In both cases, you need to file a tax return annually to report your income and any expenses that can be deducted.
Tax-deductible expenses can be claimed and mostly include work-related costs needed to earn your income, like car, travel, clothing, and self-education expenses. For an expense to be deductible, you must have paid for it yourself (without reimbursement) and have a record of it. Other work-related expenses, like accommodation during work trips, phone, internet, and overtime meal expenses, as well as non-work-related deductions, such as donations, investment-related costs, and tax-management expenses, can also be claimed.
Taxpayer response across different income groups
We applied a method, called difference-in-differences, and compared the changes in economic conditions of taxpayers living in the Brisbane River catchment area as the treatment group with taxpayers in demographically and economically similar zones in Sydney, Melbourne, Adelaide and Perth as the control group. Our analysis satisfies the necessary assumptions for the validity of this method, such as the parallel trends assumption. To further maintain the comparability of these two groups, we limit our sample to taxpayers who stay within the treatment or control regions post-disaster.
We found a temporary 1.2% drop in income for people living in flooded areas of Brisbane in 2011 compared to 2010, relative to the control group. This was accompanied by a 1.7% increase in tax deductions, leading to a 3.2% reduction in taxes owed that year. We did not observe significant changes in income or taxes in later years, though there was also a 1.9% rise in tax deductions in 2013 compared to the control group.
On average, disaster victims claimed more deductions and paid less in taxes. The average affected taxpayer paid AU$338 less in taxes in the disaster year, leading to an estimated AU$192 million reduction in tax payable from the disaster region. If we include individuals who moved away from the disaster regions following the disaster, the tax loss increases to AU$385 million.
Different income groups were impacted differently. The low-income group saw no change in income, deductions, or taxes owed. However, both the middle- and high-income groups experienced a 1.1% drop in income during the disaster year, resulting in lower taxes owed. Middle-income individuals did not change their tax deductions, while high-income individuals increased their deductions in 2013 compared to the control group.
The insignificant effects in 2011 and 2012 may arise due to the one-off flood levy applied to unaffected taxpayers, which took effect on July 1, 2011. This levy was 0.5% to 1% for those with taxable incomes over AU$50,000 and AU$100,000, which may have influenced taxpayers in the control group during those years.
Since the year 2010 may be too narrow reference period for comparison, we next compare the disaster effect to a longer pre-disaster average in the period 2008–2010 to capture longer term behaviour. This picture is slightly different. Low-income individuals experienced a 2% drop in income and a 4.1% decrease in taxes in 2011. The middle-income group saw a 1.3% income decline and a 3.8% tax reduction but did not change their deductions. The high-income group had a 1.3% income drop and a 2% reduction in taxes, while increasing deductions by 2 to 4% over the three years after the disaster.
Overall, tax reductions were 4.1% for low-income, 3.8% for middle-income, and 2% for high-income groups. Notably, high-income taxpayers consistently increased their deductions by 2.1% in the disaster year, and by 2.1% and 3.6% in the following years.
Tax deduction items as a mechanism
The disaster didn’t affect non-work-related deductions but did increase the work-related travel deductions for high-income taxpayers, who raised their claims by 1.5% and 2.2% in the two years after the disaster. In contrast, middle-income taxpayers saw their travel deductions drop by 4.6% and 3.9%, while low-income taxpayers showed no change, likely due to less travel in their jobs.
For “other” work-related expenses, low-income taxpayers increased deductions by 3.4% in 2011 and 3.9% in 2012, while middle-income earners had smaller increases of 1.5% and 1.7%. High-income taxpayers showed no significant changes.
Importantly, deductions for gifts and donations rose by 6% to 13% across all income groups, suggesting the disaster made victims more empathetic, in line with other studies.
Occupational data explains some of these patterns: high-income earners likely traveled more to restore business, while middle-income workers, such as those in hospitality, reduced travel. Increased clothing deductions likely reflect the need for new uniforms after the disaster. Further data on work hours or occupations would provide more clarity on these changes.
Conclusion
Our findings have key policy implications. Post-disaster relief programs need to be carefully designed. After disasters, governments often allocate large amounts of funds, but efficient distribution is difficult. Following the 2010–2011 Queensland floods, the Australian government directed over 90% of the AU$6 billion recovery budget to businesses. Our results suggest this strategy probably helped keep businesses afloat and saved jobs, preventing severe income shocks. A similar approach was used globally during the COVID-19 pandemic.
We also found that tax revenue loss from the floods was limited, likely due to effective post-disaster management by the Australian government, which minimised the income disruptions.
However, the floods affected income groups differently. To reduce post-disaster income inequality, future recovery programs should consider the vulnerabilities of specific economic groups. Sectors with a high proportion of small business owners, part-time workers, women, and young workers are often more exposed to disaster-related economic shocks.


Recent Comments