

Double-counting Disability Support Pensioners
Most importantly, the approach taken in the IPA research note involves a very significant level of double-counting.
This is because many of the people accessing the NDIS also receive the Disability Support Pension. According to the Australian Federation of Disability Organisations, around 77% of adult NDIS participants received the Disability Support Pension in 2018. This ranged between 64% of 16 – 24 years old, 88% of 25 – 34 years old, 83% of 35 – 44 years old, 81% of 45 – 54 years old, 81% of 55 – 59 years old, 79% of 60 – 64 years old, and 57% of those 65 – 69 years old.
Figures from the Employment Outcomes Report of the NDIS show that this share had reduced to 71.4% in 2020 and 66.7% in December 2022, suggesting if anything that people in the NDIS were reducing their use of “welfare payments”.
More fundamentally, it is simply not meaningful to double count the people benefiting from the NDIS but already receiving Disability Support Pension as an increase in “dependency”.
There is also the possibility that some of the people in the NDIS are receiving Jobseeker Payment, as there has been a significant increase in the share of people on that payment with a reduced capacity to work. As the Brotherhood of St Laurence has pointed out, this is the result of a series of policy changes starting in 2006 and reinforced in 2011-12 to make accessing the DSP harder for young people.
The latest DSS data show that at June 2024, around 43% of people receiving Jobseeker were classified as having a partial capacity to work, compared to 23% in 2013 and 39% in 2018.
This is likely to increase the extent of double-counting.
What has really happened to the number of people receiving social security payments?
As discussed earlier, if we simply look at the number of people receiving actual social security payments rather than including (and double-counting many) NDIS participants, then the increase in the number of people receiving the payments considered by the IPA is around 60,000 rather than 425,000.
This modest upward trend, however, is primarily caused by two policy changes that moved people from payments that the IPA did not include in their analysis onto the four payments they chose to count.
In 2018, there were 12 other payments to people of working age in addition to these four (and Age Pension) while in 2023 there were 5 other payments (plus Age Pension). These other payments covered about 680,000 people in 2018 and 637,000 in 2023.
In March 2020, the JobSeeker Payment replaced the Newstart allowance for the unemployed and seven other more minor payments. In 2018, the number of people receiving these payments that no longer existed in 2023 was around 30,000, so that around half of the small increase of 60,000 could be accounted for by this shifting people from these other payments.
More significantly, beginning in 2017 the Age Pension age started to increase from 65 to 67 years. This meant that people who had previously transferred from other payments on to the Age Pension on their 65th birthday or who became unemployed or acquired a disability after their 65th birthday no longer received an Age Pension.
DSS data show that the number of people on unemployment payments over the age of 65 increased from around 10,600 in 2018 to 39,800 in 2023, and the number on DSP aged 65 and over increased from 72,600 to 126,600, for a combined increase of over 80,000 people. Other payments such as the Carer Payment, also saw an increase in recipients aged 65 and over.
So, if we adopt the IPA approach, we would treat a 66-year-old receiving an Age Pension in 2018 as if they were not on “welfare”, but a 66-year-old receiving the same entitlement but on DSP in 2023 as if they were on “welfare”.
So, if it had not been for the increase in the Age Pension age and the merging of other payments onto Jobseeker rather than increasing by 60,000, the number of people on the payments selected in the research note is likely to have fallen by around 40,000.
The IPA’s decision to only include a selection of all the income support payments payable actually masks a decline in the share of the population receiving social security benefits between 2018 and 2023, as shown in Chart 1.
Chart 1: Share (%) of the population of “working age” receiving income support payments, June 1995 to June 2023
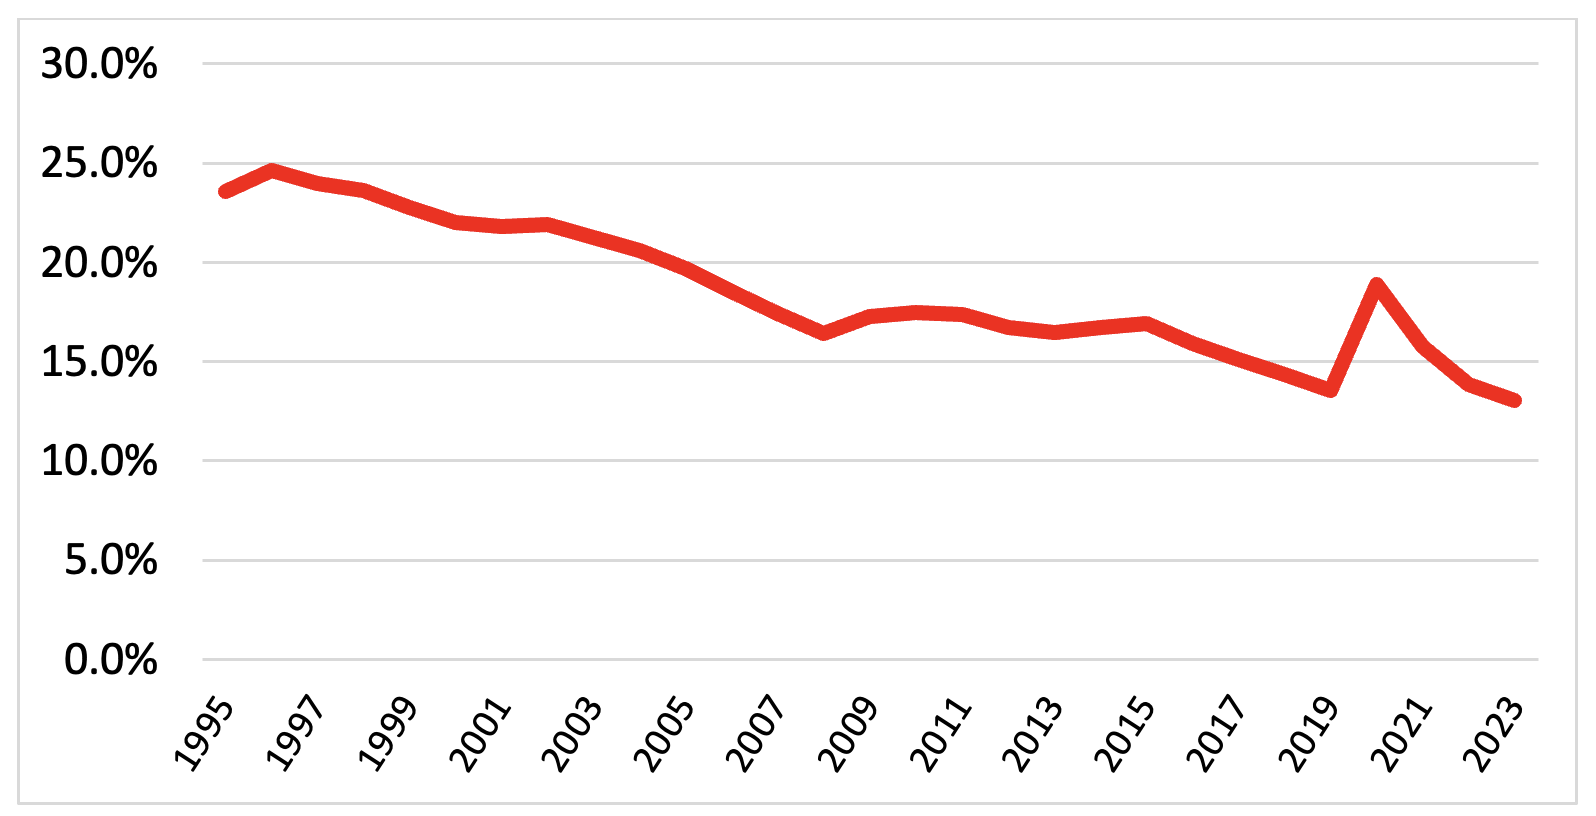
Source: DSS Income Support Customers: A Statistical Overview (various years); DSS Payment Demographic data and ABS (2023).
This is because the population of Australia has increased since 2018. Including all income support payments paid to people aged 16 to 64 years rather than a selection means that between 2018 and 2023 the share of the working-age population receiving payments (other than Age Pensions) fell from 14.4 to 13.0 per cent.
Overall, the share of the consistently defined working-age population receiving payments is about the same as it was in 1978.
Verdict
The research note from the Institute of Public Affairs selects a subset of social security payments to argue that “dependence on welfare” has increased markedly since 2018. This is wrong.
While the NDIS is a very significant spending programme, the growth in numbers of people benefiting from this assistance does not mean that the number of people relying on social security has increased. It is simply not valid to double count people on the Disability Support Pension and also receiving support from the NDIS.
A more comprehensive analysis of all payments received by Australians aged 16 to 64 years shows, however, that taking account of shifts between different payments that the share of the working-age population receiving income support has fallen since 2018.


Hi Peter,
In Part 2 of your article, you state:
“Overall, the share of the consistently defined working-age population receiving payments is about the same as it was in 1978.”
Just wanted to remind folks that, in 1978, working-age income support was income tested under a dollar-for-dollar taper rate, & had a much smaller income free area (relatively speaking) within which ‘Supplementary Assistance’ (i.e. CRA) was also abated dollar-for-dollar. These settings meant that any income earned from part-time work merely replaced income support (assuming that you didn’t lose qualification by being regarded as ’employed’ for unemployment benefit activity test purposes).
Under current income test settings, income earned from part-time work can supplement working-age income support receipt indefinitely (i.e. one can be long-term part-time employed & in receipt of Jobseeker Payment, & continue to be regarded as ‘unemployed’ for activity test purposes). This means there is a significant number of working-age income support recipients with enough (either regular, or intermittent) earned income to reduce their income support to zero under 1978 income test settings, who are still attracting non-zero rates under current income test settings.
So, given this, the number of recipients of working-age income support today who would be able to receive that support under 1978 income test settings must be lesser still (which means: “the share of the consistently defined working-age population receiving payments” has in fact fallen since 1978, despite population increase & demographic shifts over that time).
Andrew
Good point, I was referring to the age range
for what I define as consistently defined – including people aged 16 to 65 in all years, so including women getting the Age Pension at between 60 and 64 when that applied an excluding those aged 65 to 67 more recently.
Peter
Given the vogue these days for screaming about anything sex discriminatory, my recollection is that the welfare system overwhelmingly favours females – because they have greater morbidity and lower mortality than males. Is this still true?
Its 58% of recipients at March 2024 https://data.gov.au/dataset/ds-dga-cff2ae8a-55e4-47db-a66d-e177fe0ac6a0/details
They are least likely to be on DSP (47%) and Jobseeker (46%), but more likely to be caring and live longer.