

In April this year, the Institute for Public Affairs (IPA) published a research note on “The Growth and Distribution of Welfare in Australia”, claiming:
Approximately 2.1 million Australians (aged 15 and over) are currently receiving welfare through either the National Disability Insurance Scheme (NDIS), Disability Support Pension (DSP), Jobseeker, or Youth Allowance. This is approximately 425,000 higher than in 2018, before the NDIS was implemented in full and before the Covid lockdowns.
Approximately 86% of the growth to the total number of people on welfare since 2018 is from the NDIS.
The story was also reported in a wide range of metropolitan and regional newspapers and on Sky News.
I wrote an article questioning this analysis that was published in The Conversation on 12 April.
As I pointed out then these data are incomplete. Only four of Australia’s income support payments are included: the Disability Support Pension, JobSeeker, Youth Allowance (Other) and Youth Allowance (Student and Apprentice), as well as the National Disability Insurance Scheme, which is not an income support payment.
This means the quoted data cover only about three-quarters of the working-age Australians receiving income support payments, and none of the older Australians receiving the age pension – more of which later.
The IPA don’t actually give a source for any of the data that they included in their research note. The research note is less than a page of text describing another three pages of charts and two tables of the percentage and numbers for Australia as a whole, and a second Table 2 – which is 15 pages long and gives the percentages of people in each of Australia’s local government areas receiving welfare as defined by the IPA.
There are no data sources identified for any of these calculations.
Comparing IPA and government data
As someone who uses the Department of Social Services’ (DSS) administrative data on a regular basis, I knew that you can get the data for the number of recipients of these and other payments from DSS Benefit and Payment Recipient Demographics – quarterly data for March, June, September and December each year, since September 2013.
In my article for The Conversation, I compared the numbers receiving payments at June each year with the figures in the IPA Research Note.
I normally look at trends in June each year as this is the end of the financial year. More importantly, it is then also possible to compare the number of recipients of social security payments with the estimated resident population of Australia because the Australian Bureau of Statistics (ABS) publish these data for the population at 30 June, by sex and single year of age, from 1971 onwards.
It is important to benchmark the number of social security recipients to the population estimates to calculate the rate of receipt of payments (%), since the population of Australia increased from 23.1 million in 2013 to 26.7 million in 2023.
However, after a bit of trial and error, I have now concluded that the figures for Australia in the IPA Research Note are for actually for December each year.
The table below compares the number of people receiving the four payments counted by the IPA since 2013, taken from DSS administrative data for December each year. Between 2013 and 2018 the numbers in the IPA report and the DSS data (for each state as well as the Australian total) are identical.
The title for the table in the IPA report is “Number of people on welfare – including NDIS, DSP, Jobseeker, or Youth Allowance (does not include age pension)”.
Table 1: Comparing DSS and IPA numbers “on welfare”, Australia, 2013 to 2023
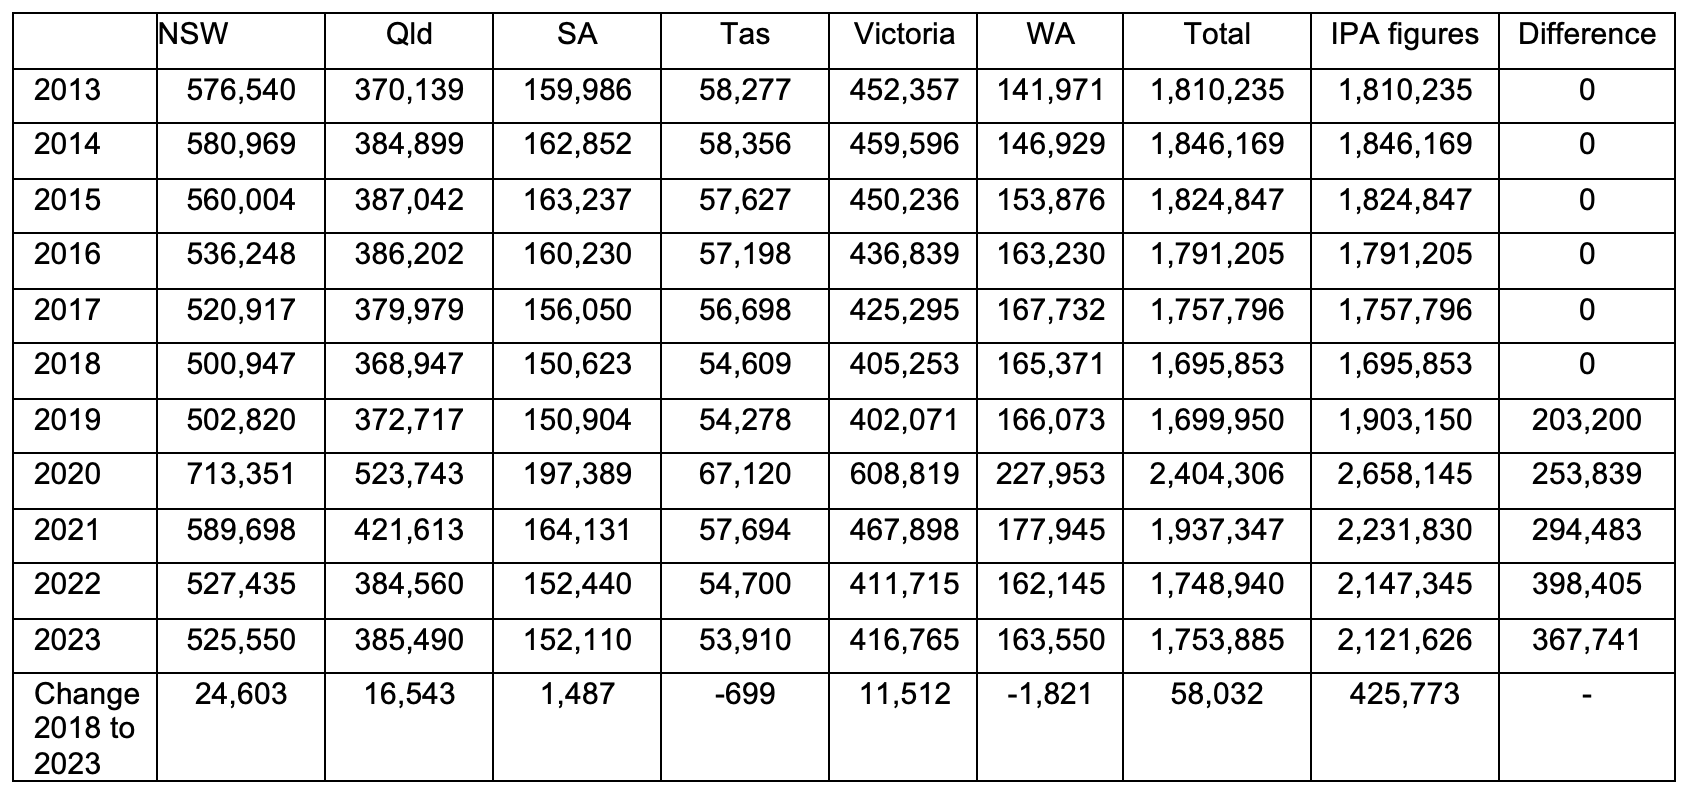
Note: The Australian total includes the ACT, the NT and a small number of unknown.
Source: The numbers in columns 1 to 7 are from DSS Benefit and Payment Recipient Demographics – quarterly data for December each year; the figures for the IPA are from Table 2 of “The Growth and Distribution of Welfare in Australia” (Page 2); the difference is the total numbers given by the IPA minus the DSS administrative data.
As an aside, I haven’t checked how the IPA calculated the percentages in their Table 1 as the numbers they use are for December, while the population data are for June each year. Similarly, the figures in their second Table 2 for the percentage of people receiving payments by local government area also involve comparing ABS data for June with DSS data for either June or December. Since their research note doesn’t give any sources or description of their methodology, it is unclear how they actually calculated any percentages.
Why the numbers in the IPA report are very, very wrong
The figures in the table above show that the IPA figures and the DSS figures for December 2013 to December 2018 are the same.
If you just look at the number reported by the DSS then the increase between December 2018 and December 2023 is a little less than 60,000.
The numbers that the IPA give and the DSS numbers diverge from 2019 onwards, and the difference between the IPA numbers for 2018 and 2023 is around 425,000, as they state.
Does this mean that their calculations are correct? Well, no – they are still very wrong.
Given that the DSS numbers in the table are correct, this means that the difference between the DSS data and the IPA figures must be their count of the number of people in the NDIS.
But just as they do not give the source for the DSS numbers, they do not give a source for any of the numbers they say are receiving support from the NDIS.
The National Disability Insurance Agency does publish statistics on the number of participants over time. The full roll-out of the NDIS commenced in 2016, and at 30 June 2018 there were just over 172,000 participants with an approved plan.
The most recent Quarterly Report to Disability Ministers shows that the number of active participants increased to 610,500 at 30 June 2023. Historic data on participant numbers can be downloaded, although these only start at March 2019.
There is obviously a serious question of whether the NDIS constitutes a “welfare payment”. As Don Arthur of the Parliamentary Research Service point out in Welfare dependency: the history of an idea, most discussion of “welfare dependency” identifies welfare as receipt of cash payments to cover basic living costs.
The NDIS does not provide recipients with cash or provide help for basic living costs.
It makes little sense to argue the NDIS provides participants with an alternative to work. In fact, the NDIS offers participants assistance to maintain employment. It also has the potential to help carers of people with disabilities participate in employment. For example, the December 2023 Quarterly Report states “Participation in work has more than doubled from 10% to 22% for participants aged 15 to 24 years. Half of all parents and carers are now reporting paid employment, reaching the 2023–24 target of 50%. This is a relative increase of 10%.”
While it is a very significant spending programme, there are more significant reasons why it simply does not make sense to add the number of people in the NDIS to the number of people actually receiving income support payments.
Table 2: Comparing DSS and IPA numbers “on welfare”, and NDIS participants, Australia, 2013 to 2023
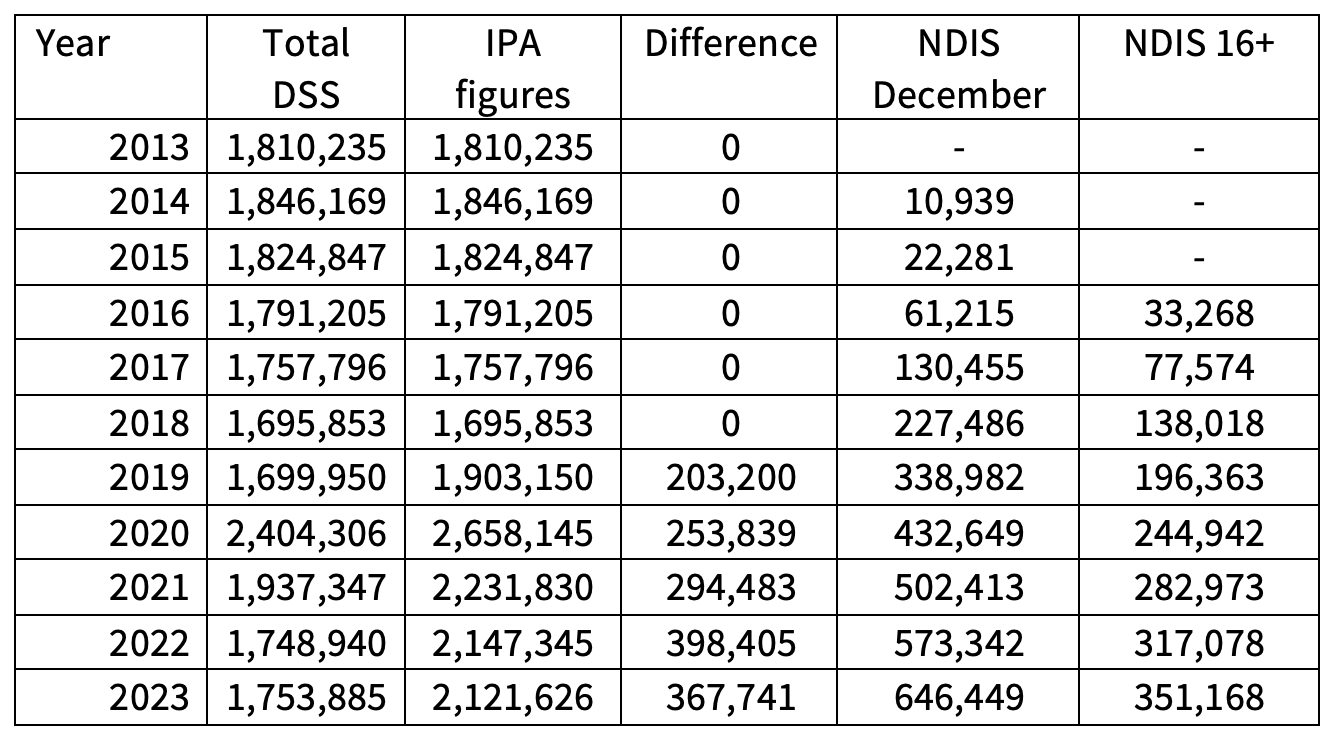
Source: The numbers in columns 1 are from DSS Benefit and Payment Recipient Demographics – quarterly data for December each year; the figures for the IPA are from Table 2 of “The Growth and Distribution of Welfare in Australia” (Page 2); the difference is the total numbers given by the IPA minus the DSS administrative data; the final two columns are the total number of NDIS participants at December each year and the number of NDIS participants aged 16 years and over (data supplied by the National Disability Insurance Agency: NDIA Request ID: DIPMO-22019 ANU).
Table 2 shows the number of people participating in the NDIS in December each year as well as the number of people aged 16 years and over participating in the NDIS. These data were supplied by the National Disability Insurance Agency as a result of a special data request.
The table shows that a significant number of participants are children up to the age of 15 years. In December 2023, around 46 per cent of NDIS participants were aged less than 16 years. Clearly, it is not correct to add children to the number of people receiving benefits, who are aged 16 years and over.
It appears that the IPA Report may adjust for this, but they don’t explain this in their Report, and again they give no source for their calculations. Comparing the last column of Table 2 with the “difference column” shows that for most of these years since 2019 the number of NDIS participants aged 16 aged over is broadly similar to the calculated difference; for example, in 2019 the “difference” was just over 200,000 and the number of adult participants was just under 200,000, while in 2023 the difference was around 20,000.
These differences may be due to the fact that the figures for the number of children in the NDIS that are published on the NDIA website are for children up to the age of 14 rather than 15 years. The figures for 2022, however, are very significantly different.
While the IPA Report does appear to have tried to make this sensible adjustment – but doesn’t explain whether they did this or where their numbers come from – there are much more significant issues that completely undermine their analysis.
One of the most important is that in their report and in the media, the IPA consistently refer to the growth in numbers since 2018. But they do not include anyone who was actually receiving support from the NDIS in 2018.
As Table 2 shows in fact, in December 2018 there were already 138,000 people aged 16 and over receiving support from the NDIS. These people are ignored by the IPA. While the numbers are smaller in earlier years, this is because the scheme was not fully rolled out, and prior to that many people received support services either from State or Territory governments rather than the Federal Government.
On this point, for example, the 2017-18 Annual Report states that of the 184,000 recipients at 30 June 2018 (not all of whom had an approved plan), “nearly 55,000 participants previously never had that support”, implying that many participants were already receiving some form of State government support before they benefited from the NDIS.


But what is welfare?
Are family allowances/payments welfare?
A lot of so-called welfare simply represents a shift of income support away from families (nuclear or extended) to the State.
This started in 1974 with the abolition of deductions for dependants.
A truly neutral tax system would recognise private income transfers between persons so that income would be taxed in the hands of the person who enjoys it – who is not necessarily the one who earns it.
It is, for example, ludicrous that spousal maintenance or child support payments are not deductible and taxable (with appropriate thresholds etc) to recipients.
The Bismarckian welfare State is fundamentally a system of bribing voters by writing cheques on the wages of other people’s earnings and on their children -a demographic Ponzi scheme.